
National PFAS study releases first report of findings
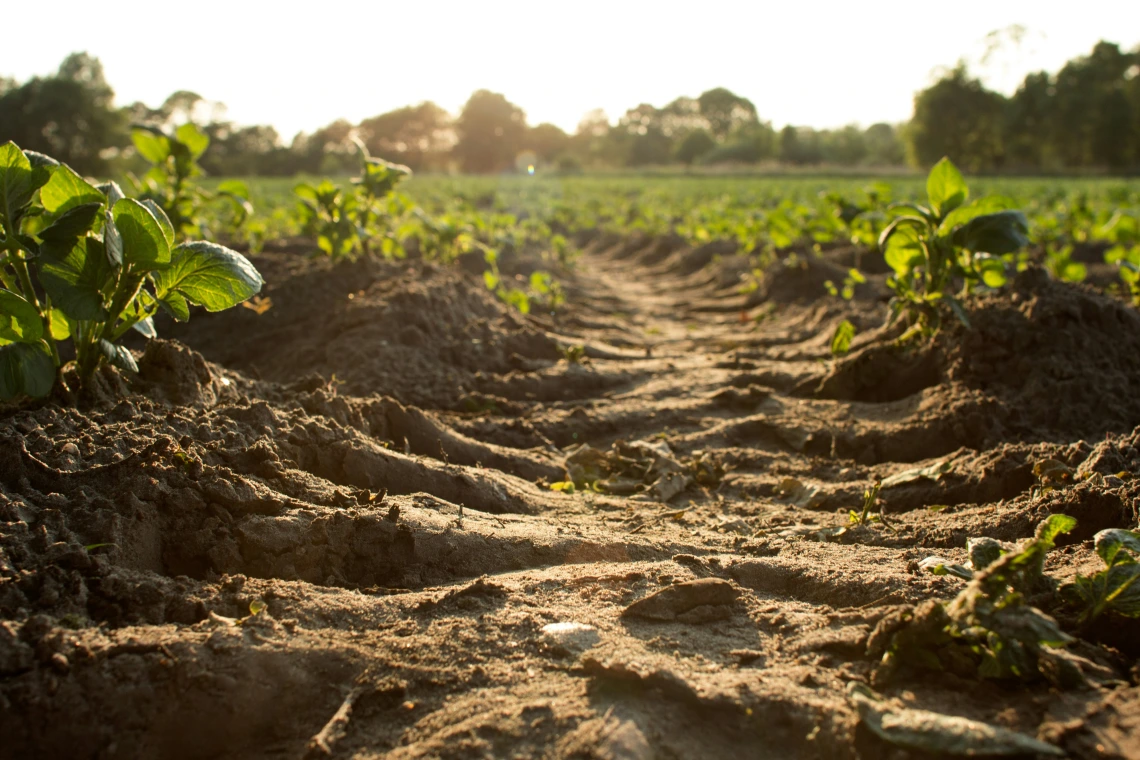
Photo by Dylan de Jonge on Unsplash
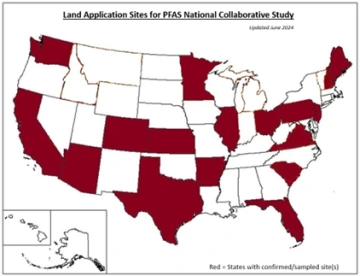
States where samples were collected for the national study
In January 2025, Phase I findings of the multi-year National Collaborative PFAS Project were released. The study, led by Dr. Ian Pepper and funded by public and private entities, is designed to evaluate the incidence and mobility of PFAS in soils with a history of land application of municipal biosolids. Partners from 23 sites in 17 states across the country (see map) provided soil samples from land application and control plots (no biosolids applied). Samples represented a variety of different soil types, depths to groundwater, climates, and irrigation methods. When possible, sites also provided samples of water and/or biosolids for analysis.
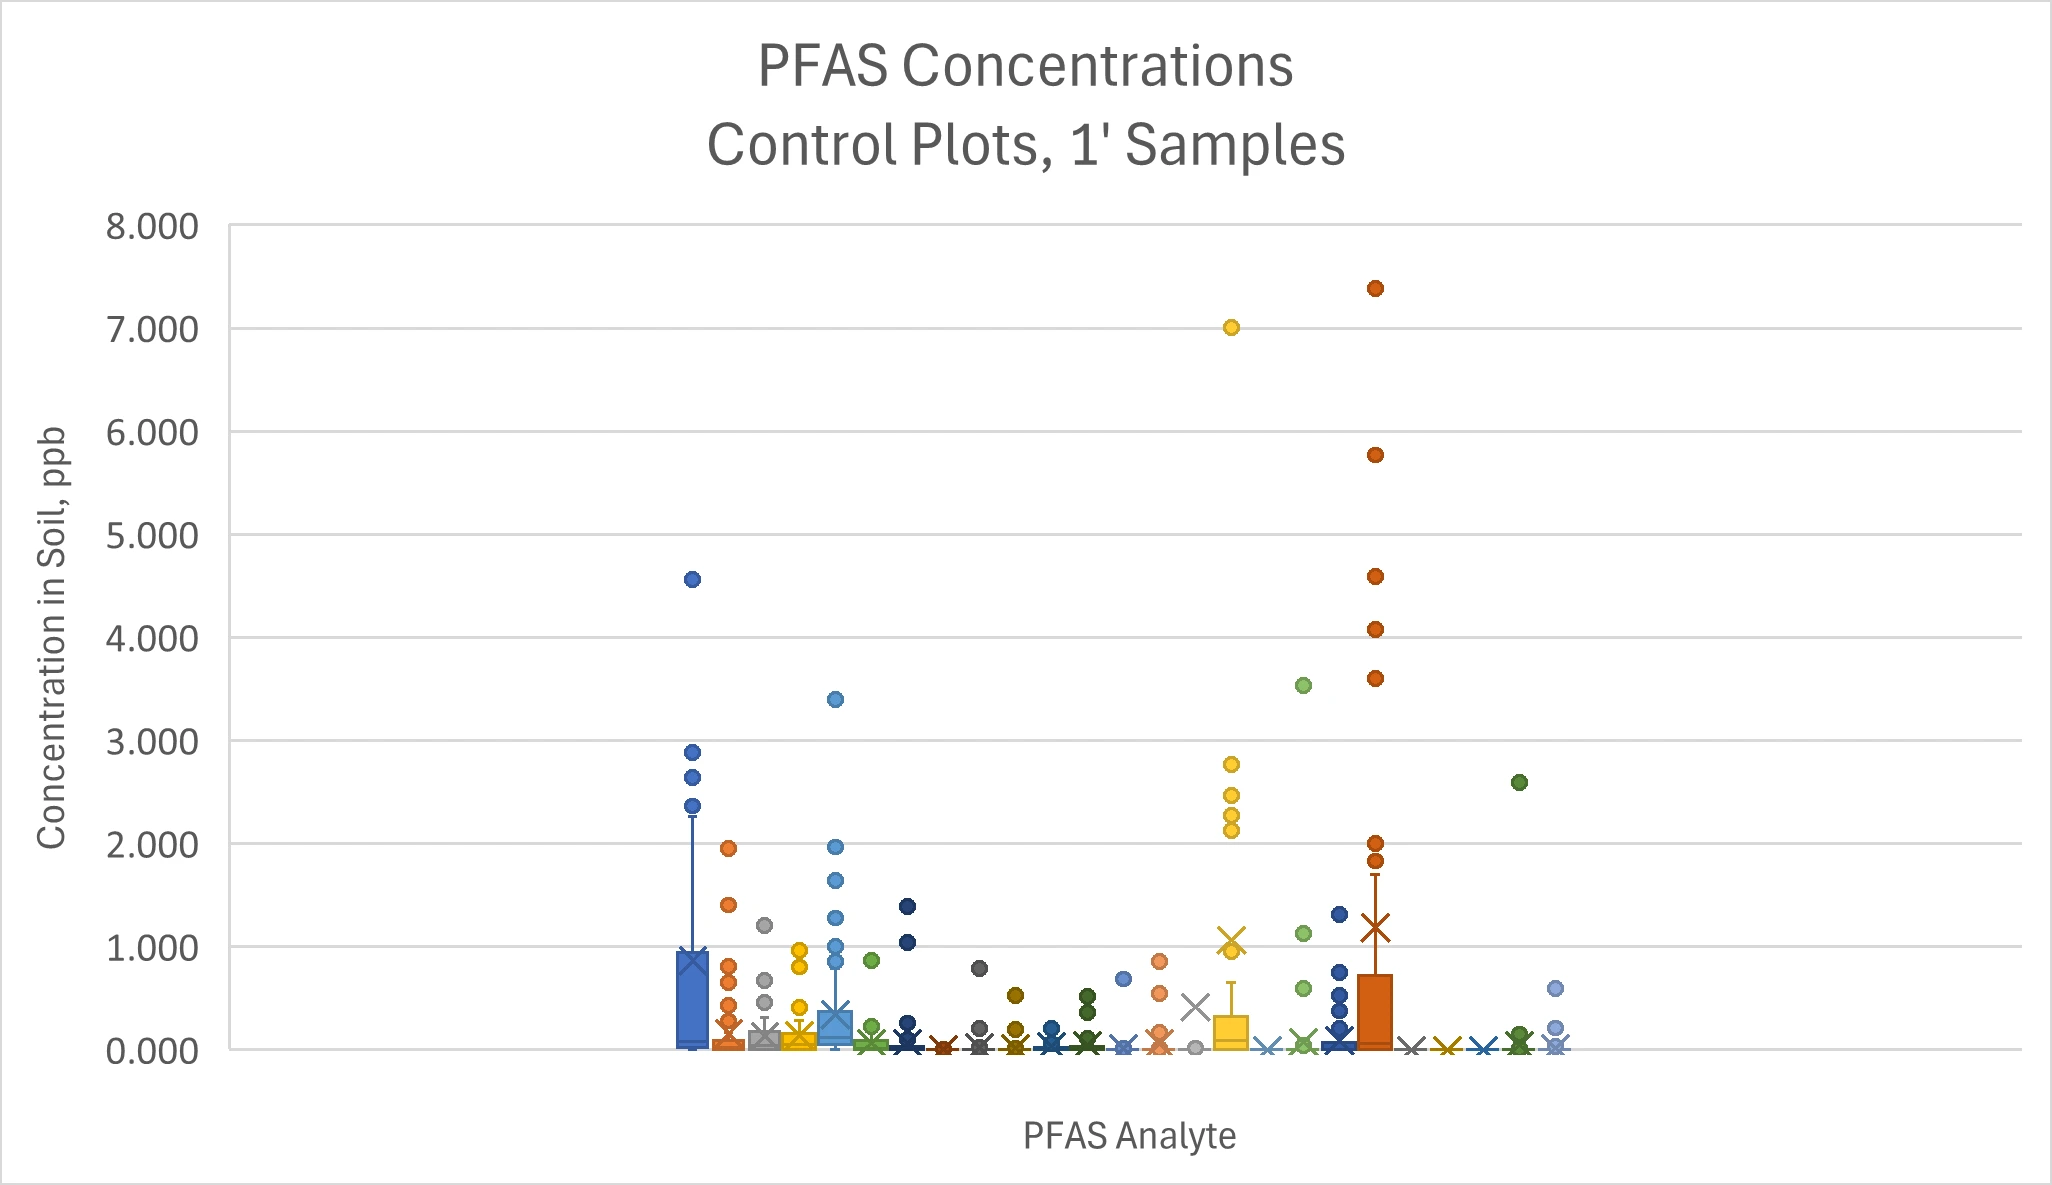
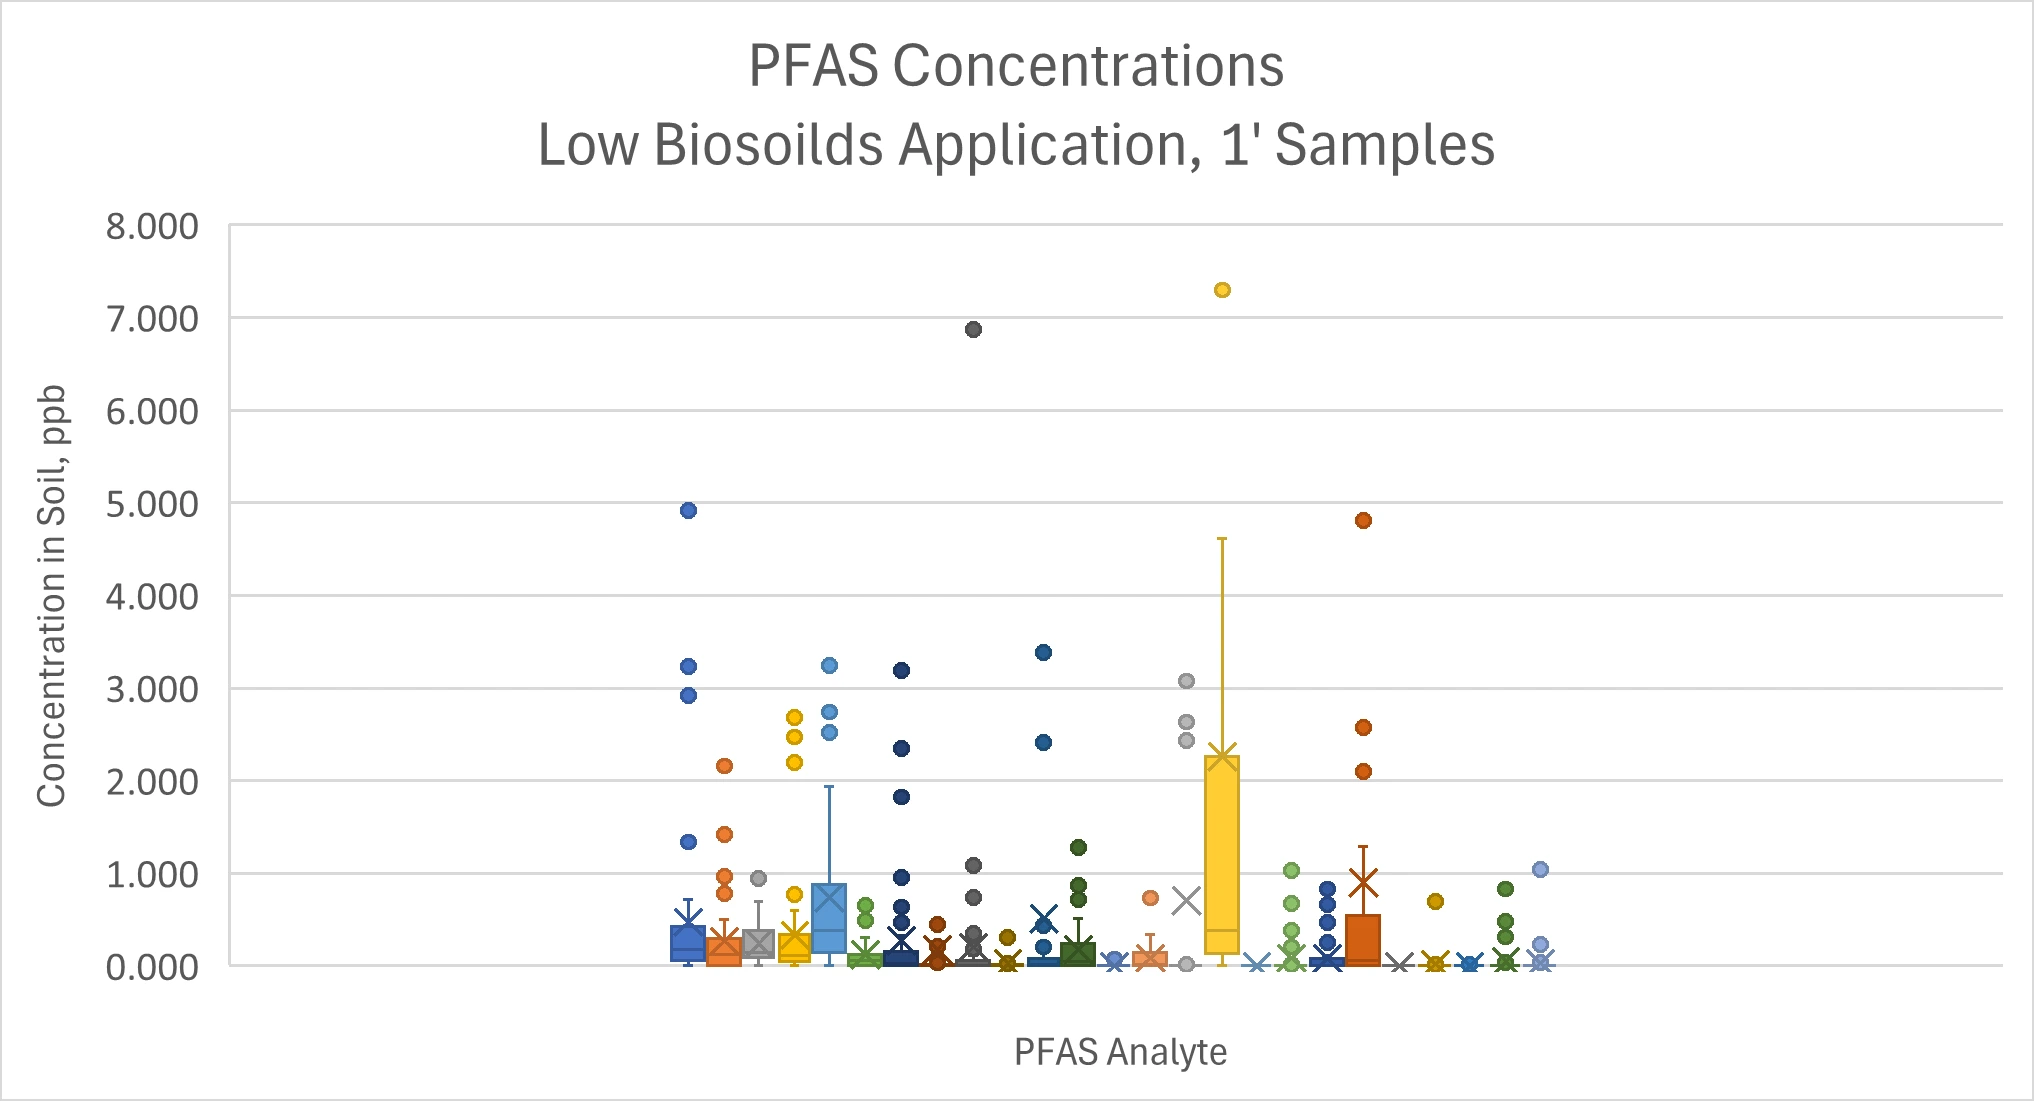
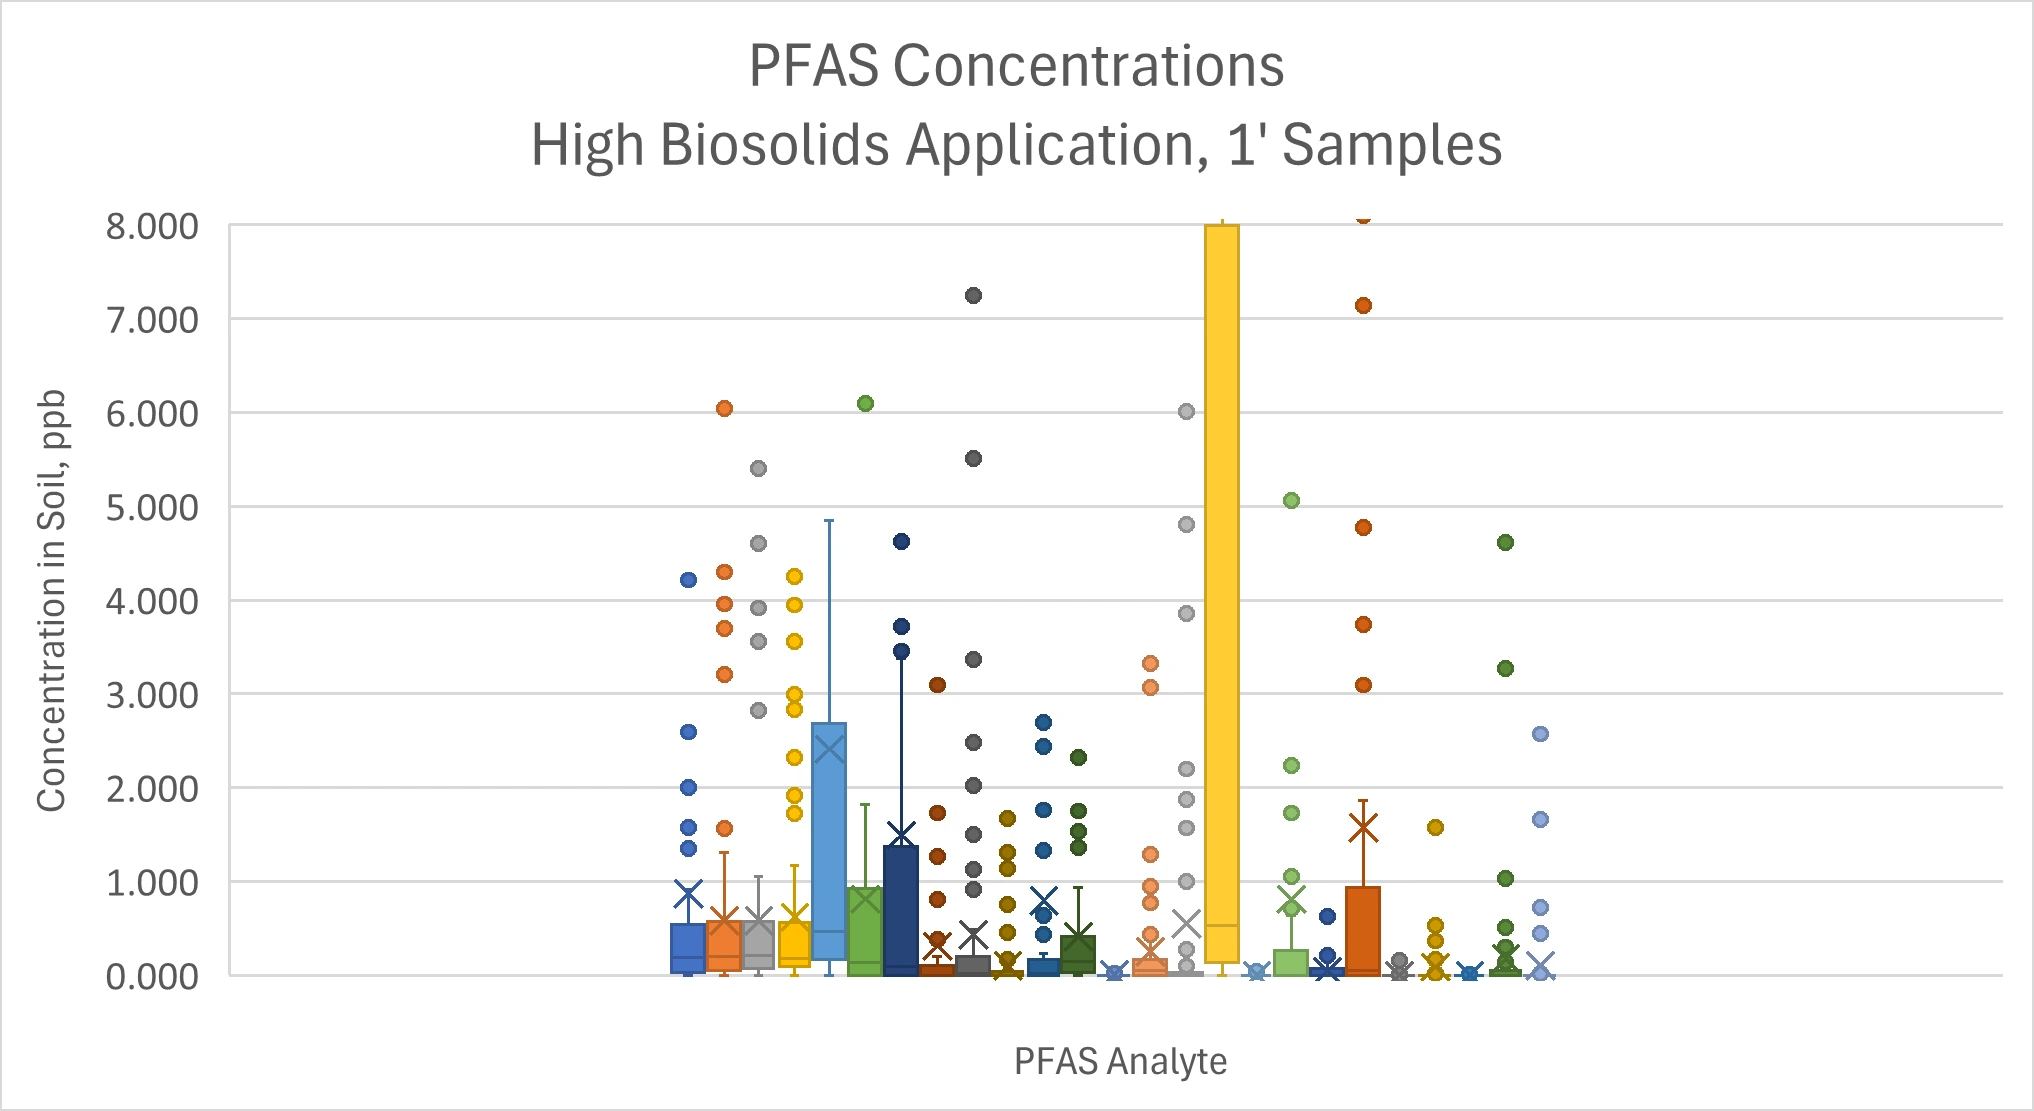
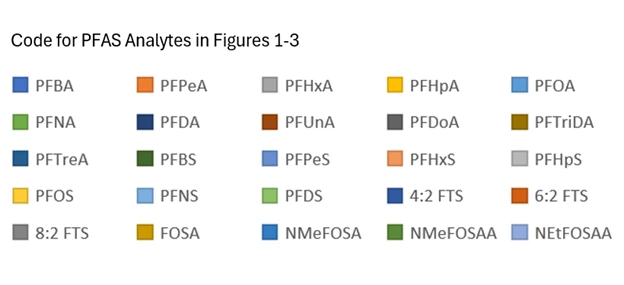
Figures 1-3 show the distribution of concentrations of PFAS analytes in 1-foot samples at Control, Low Biosolids, and High Biosolids plots. Due to scaling, upper/outlier values of several compounds are not shown in the charts. A key to PFAS compounds in Figures 1-3 is shown in Table 1. Information about 3-foot and 6-foot samples can be found in the full report (below).
Drawing on the robust dataset, results showed:
- Control plots: Overall concentrations of all PFAS analytes were low for Control plots (Figure 1).
- Low Biosolids plots: Concentrations of PFAS analytes in Low Biosolids plots (Figure 2) were still low, but higher than Control plots. Note that several mean values in the 1-foot samples were greater than 1 parts per billion (ppb), including PFDA, PFUnA. PFHps, 6:2 FTS and PFOS. However, median 1-foot concentrations are all less than 1 ppb. PFAS concentrations in deeper samples (3- and 6-foot) showed similar trends, but also significant attenuation with increased soil depth.
- High Biosolids plots: Samples from High Biosolids plots (Figure 3) generally showed increased soil PFAS concentrations relative to Control and Low Biosolid plots. Yet again, significant attenuation occurred with increased soil depth.
- Biosolids: Concentrations of analytes in biosolids were universally low with the exceptions of samples from Site 7 and Site 19.
- Groundwater: Only 10 sites out of the 23 were able to provide water samples. Additionally, sources and methods of collection of water samples varied from site to site. Concentrations of PFOA, PFOS and PFHxS were often in excess of the corresponding EPA maximum contaminant level (MCL) values, whereas PFNA concentrations exceeded the EPA MCL only once.
Click on figures/table for a larger view.
For more detailed results and a description of a modeling approach used to quantify the risk of leaching and groundwater contamination, see the full report.
Also released in January 2025 was an Environmental Protection Agency (EPA) report outlining PFAS risks and providing guidance regarding regulatory levels for specific PFAS analytes. See this report, “PFAS Strategic Roadmap: EPA’s Commitments to Action 2021-2024”, below. However, new federal leadership and changing priorities may impact EPA positions. Stay tuned!
Following the Phase I report, Phase II of the National Collaborative PFAS Project will evaluate the indirect route of exposure to PFAS from the ingestion of foodstuffs from crops grown on land application plots. At each project site, plant samples of roots, stems and leaves will be collected as well as edible crop produce. All samples will be sent to the University of Arizona for PFAS analyses at the Arizona Laboratory for Emerging Contaminants (ALEC). This will allow for crop uptake analysis.
Currently, fundraising for Phase II is underway. Crop planting is anticipated in the spring of 2025, with crop sampling and harvesting undertaken in the summer and fall of 2025.